The February IMSA WeatherTech Test allows both Prototype, Prototype Challenge, GT Le Mans, and GT Daytona teams and IMSA officials to continue assessing on track performance of 2017 cars.
The P1Analysis.com reports service makes it easier for IMSA WeatherTech and Continental race team subscribers to get quick, clear insights into each of their weekend sessions.
The P1Analysis charts below use box plots to show the lap time distributions of P, PC, GTLM, and GTD teams, by driver, color coded by Make.
Prototype
Session 1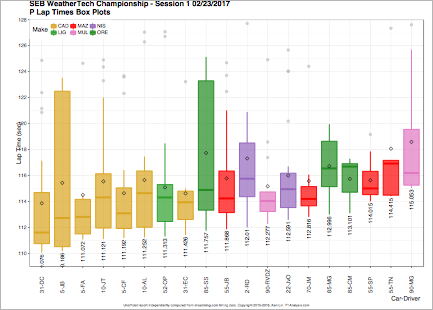 |
Session 2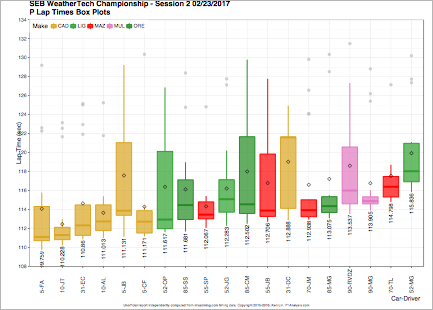 |
Session 3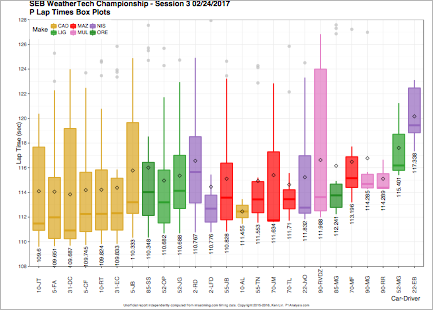 |
Session 4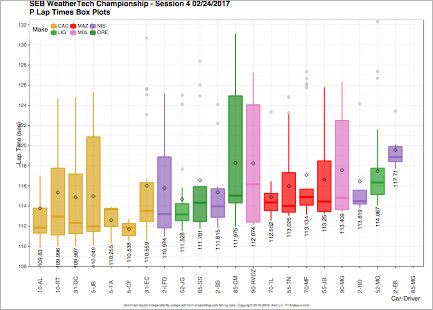 |
Prototype Challenge
Session 1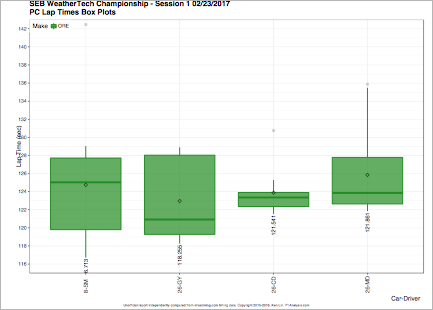 |
Session 2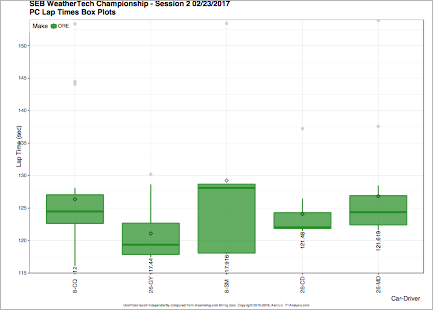 |
Session 3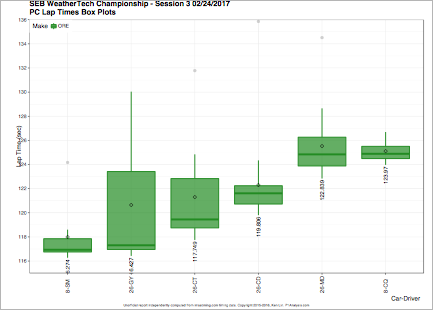 |
Session 4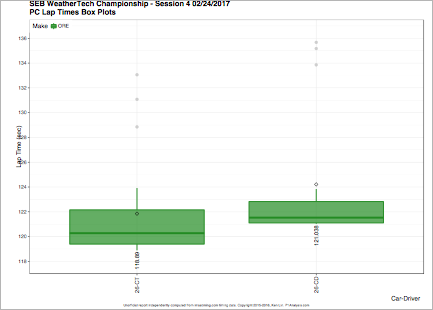 |
GT Le Mans
Session 1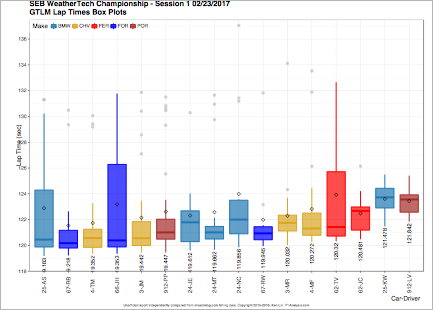 |
Session 2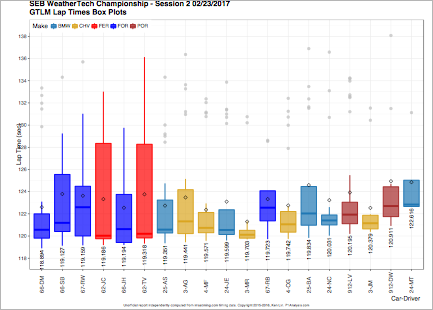 |
Session 3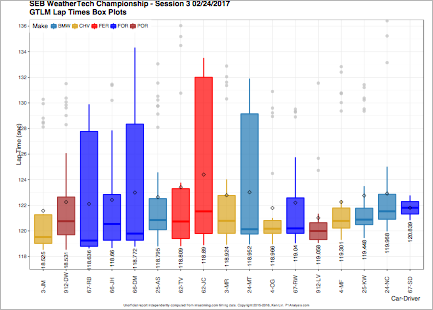 |
Session 4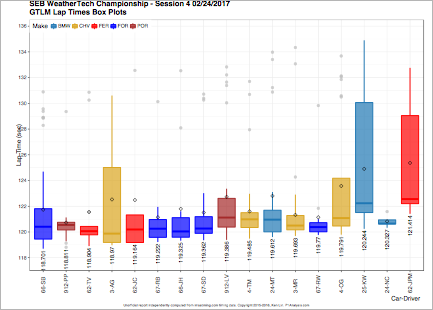 |
GT Daytona
Session 1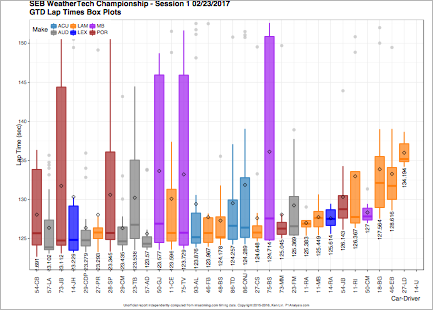 |
Session 2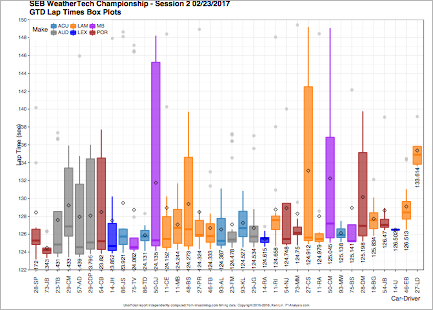 |
Session 3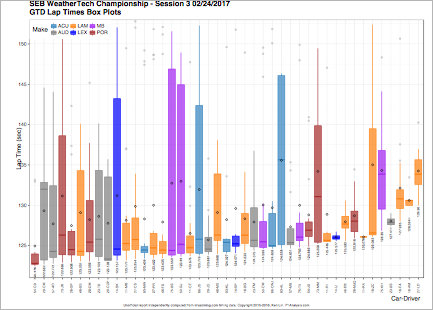 |
Session 4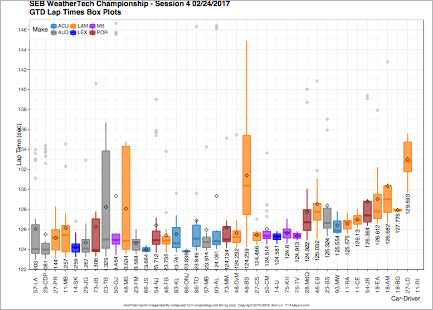 |
The Lap Time Box Plots are just one of the several P1Analysis.com report types. P1Analysis Study – 2016 Rolex 24 GTLM Corvette Racing #4 takes a detailed annotated look all its report types.