The 2016 Petit Le Mans, 10 hour endurance race was held Saturday October 1, with four different classes of sports cars in the IMSA WeatherTech SportsCar Championship series finale.
The P1Analysis.com service creates reports that make it easier to visualize the story behind each of the four concurrent races.
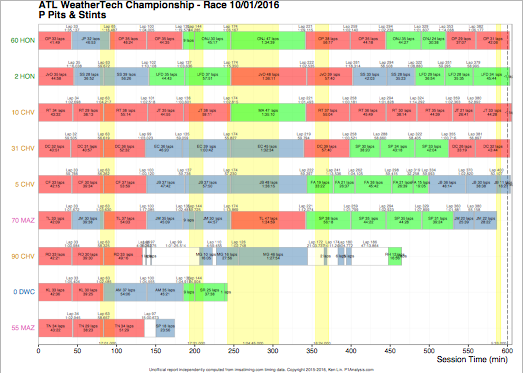
Prototype Class
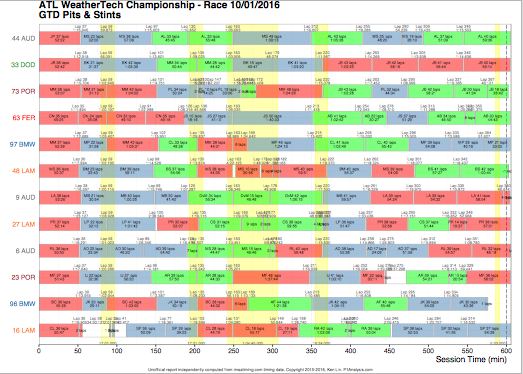
Managing pit stops and drivers changes are important part of endurance race strategy. The pits and stints chart not only makes it easy to compare each team’s strategies.
- We can quickly see that only 5 of the 8 cars took the checkered flag.
- During mid-race, an extended full course yellow session needed to repair turn 3’s asphalt. Some teams made clever use of that period to have their slower drivers satisfy the minimum drive time requirements.
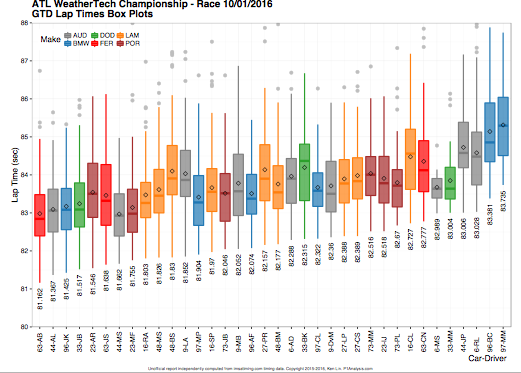
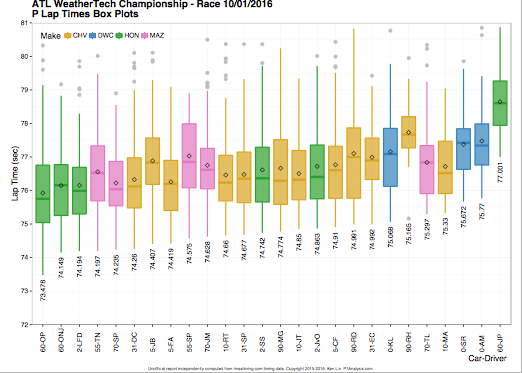
Box and whisker plots allow you to quickly visualize each individual driver’s lap times distributions.
The lap times used in each driver’s plot again excludes pit-in, pit-out, and caution laps. Plots are ordered by each driver’s fastest lap time (lowest point on plot, either whisker or outlier) which is labeled. Details on the math behind how box and whisker plots are created can be found at P1TS’s Understanding Box and Whisker Plots.
- Roughly, the colored rectangular box represents the “meat” of the lap times considered. The colored box consists of 25% of the lap times faster (lower portion of the box) and 25% slower (upper) than the driver’s median lap time.
- The driver’s median lap time is indicated by the colored horizontal line inside the box while mean (average) is marked by the black diamond.
- The colored whisker lines extending above and below the box, show the lap times lying within a certain distance from the colored box.
- Those lap times falling outside the whiskers are known as statistical outliers and are marked by gray circles. Slow outliers usually indicate typical slow laps during a session. Fast outliers occur less frequently and depending upon the conditions, may possibly suggest sandbagging.
- What’s apparent below is that the #60 Michael Shank Racing Honda-Ligier JS P2 car is fast, with the two fastest drivers.
- Olivier Pla has both the fastest lap and the fastest average (diamond).
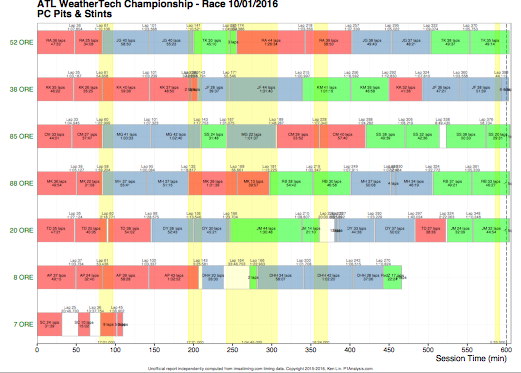
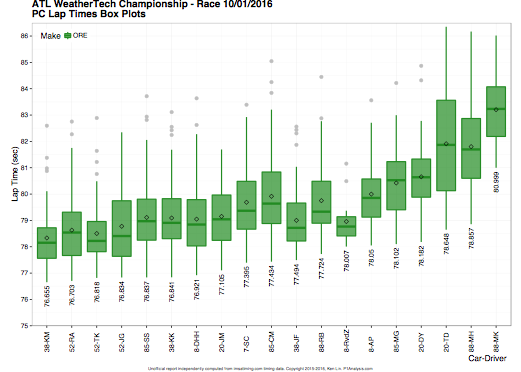
Prototype Challenge
Here are the corresponding chart for the PC class.
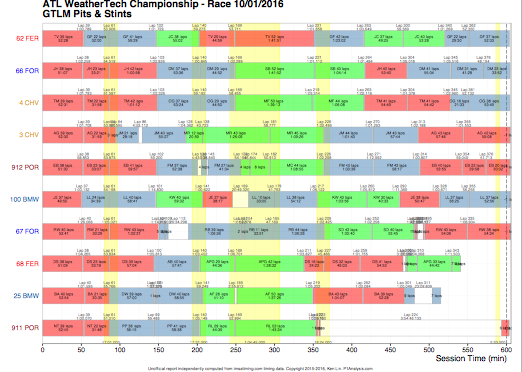
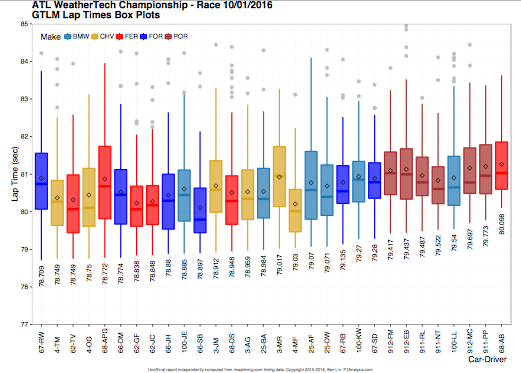
GT Le Mans
Here are the corresponding chart for the GTLM class.
GT Daytona
Here are the corresponding chart for the GTD class.